Heat has no colour
Why the warmth a data centre throws away looks red on a heat map, and what it might look like to a fungus
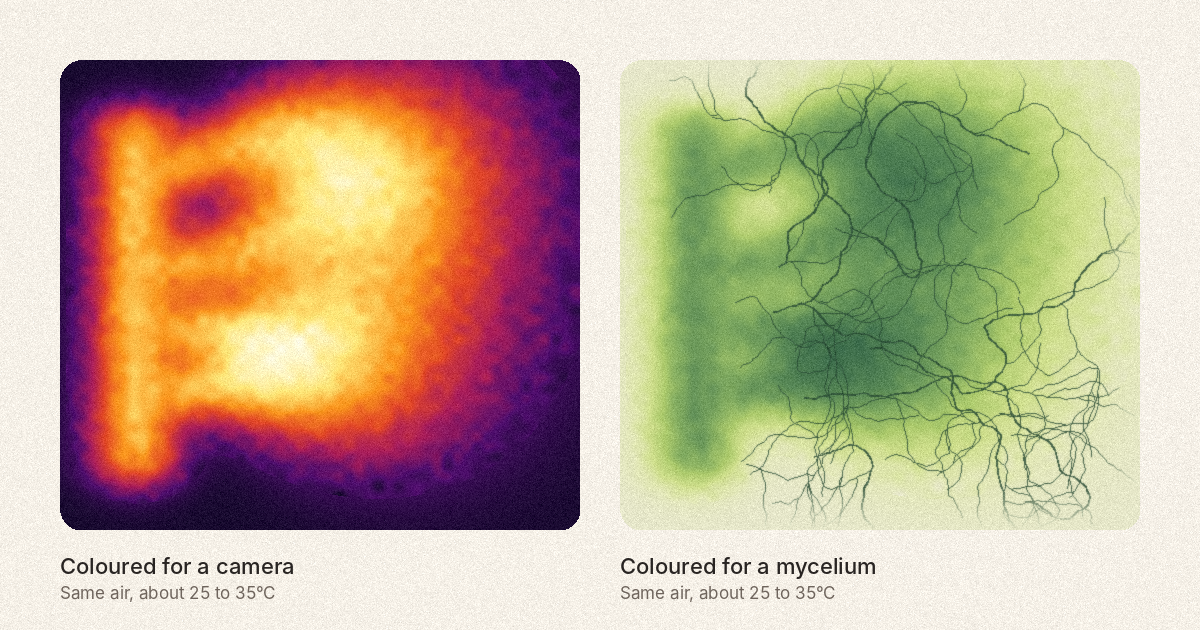
On 26 October I sent Biodesign Academy’s feedback to the European Commission on new rules for data centres. Part of it is about heat. And while I was writing it, one picture bothered me more than any number in the brief.
Search for data centre heat and you’ll find thermal images of server halls. Racks glow orange. Exhaust air streams out in red and yellow. It looks hot, and it looks like trouble.
But the heat in those pictures has no colour. Air at 30°C gives off infrared light, strongest at a wavelength of about 10 micrometres. Our eyes only see between about 0.4 and 0.7. Things don’t start to glow a dim, visible red until around 500°C.
So every colour in a thermal image is a choice. Usually someone else made it: a palette built into the camera, with names like “iron” or “rainbow”.
And that choice argues for something. Red and orange say alarm. They say get rid of it.
The EU rules don’t use heat maps, of course. But they share the picture. In the Commission’s first round of reporting, data centres reused about 1.8% of their energy. Air-cooled sites give off heat at about 25 to 35°C, too cool for most heat networks without heat pumps, and most of it comes in summer, when homes don’t want it. So it goes into the air.
Now picture the same heat from the side of living matter. Fungal mycelium grown for packaging and insulation is incubated at about 24 to 32°C. Bacterial cellulose grows at about 22 to 30°C. Many algae and cyanobacteria grow best between 25 and 37°C, depending on the strain.
For them, 30°C is about right.
That window comes down to proteins. A fungus feeds by sending enzymes out into sawdust or straw to break it down, and each enzyme works by holding a precise shape. Cold slows it. Too much warmth shakes the shape loose and it stops working. (I’m simplifying a lot, but the growing temperatures in the brief are roughly where those proteins keep their shape and get on with the job.)
So the same 30°C is “low-grade” to an engineer and just right to a mycelium. It depends on who’s being warmed.
Colour theory does something similar. In class, red and orange are warm and blue is cool. Physics runs the other way. A candle flame, at about 1,850 kelvin, gives a reddish light. Standard daylight is set at about 6,500 kelvin, and it looks bluish. The colours we call warm come from the cooler sources.
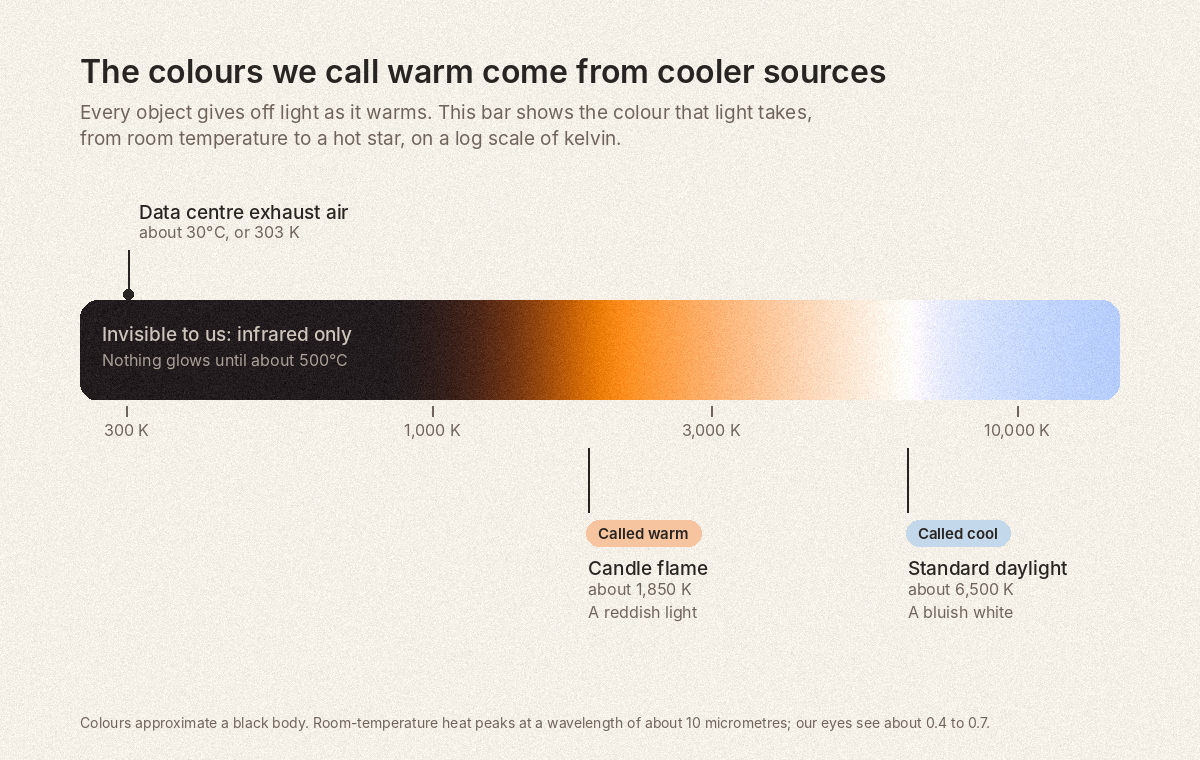
I think that’s because our words for warm and cool colours were never about heat. They’re about how things feel to a human body sitting near a fire.
That’s what our brief asks the EU to do with its heat rules: to picture heat from where a fungus, a bacterium or an alga sits, as well as a home. Reading a heat map well starts with the same move. Ask what its colours leave out, and whose body they were chosen for.
In the full Reading for members
The full version of this Reading goes on to two things that aren’t here:
Why the rainbow, the commonest choice, draws edges that aren’t in the data. What makes a palette honest, and how to check one. With a new figure comparing four palettes side by side.
Ready to run, from recolouring a thermal image for a mycelium to a quick test that shows whether any heat map is telling the truth.
Library members get every Reading in full, with teaching notes like these.
